
AUSTRALIAN ARCHITECTURAL AND DECORATIVE PAINTS SECTOR STATISTICAL ANALYSIS 2013
Architectural and Decorative Coatings (excluding Woodcare)
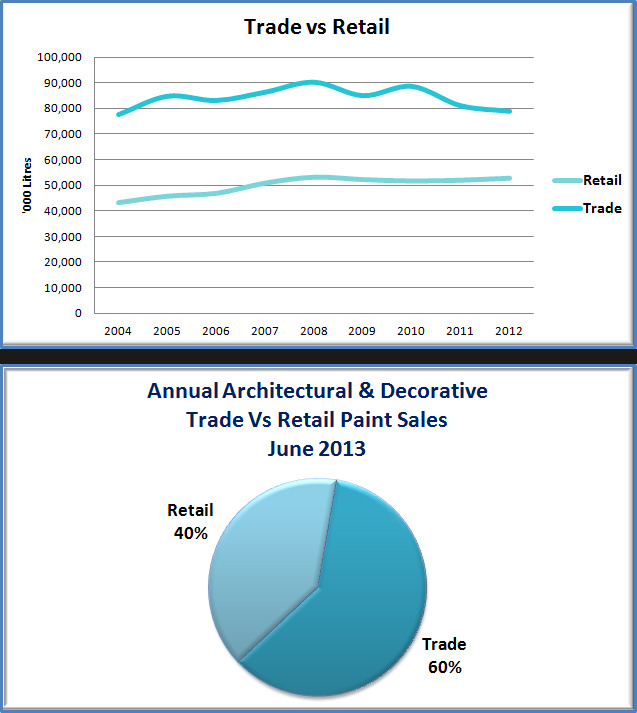
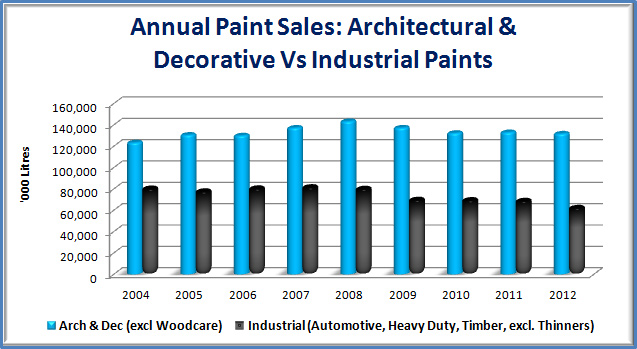
The Australian architectural and decorative paints sector had another challenging year. The residential housing market in Australia remained very soft throughout the period. Indeed, annual sale volumes, for trade sector paints, fell 4% to June 2013 to 78.6 million litres. The DIY residential market (retail sector paints) proved more resilient. Sales Volumes here went up by 4% to 51.8 million litres from June 2012 to June 2013. The percentage of architectural and decorative paints sold pre-GFC was split 35%/65% between retail and trade, whereas in 2012 the split was 40%/60%. Overall, a slight gain has occurred with retail over the 12 months, whereas trade sales have declined, by around 10%, since 2010.
Woodcare Products
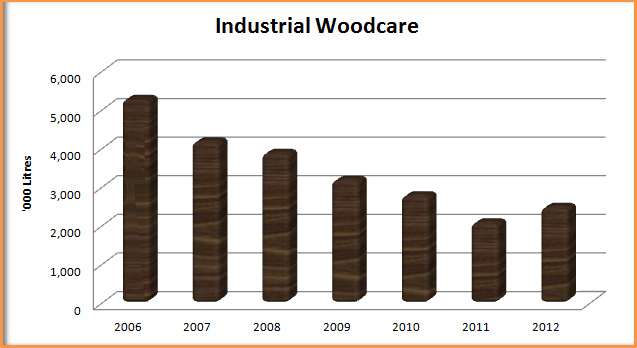
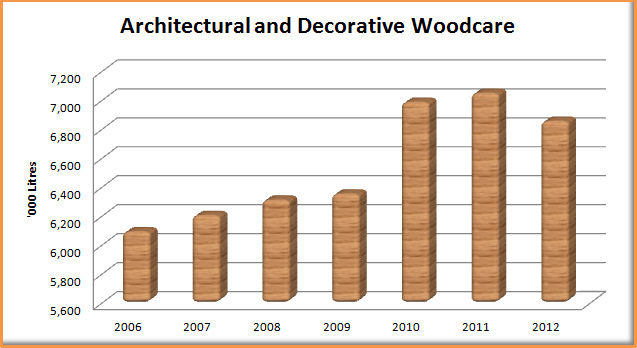
Woodcare Industrial Products have declined steadily since 2006, with a slight upturn in 2012. However, the trend for Woodcare Architectural and Decorative Products saw an overall increase over the same period (with a decline in the last period).
Industrial Paints to 30 June 2013
No surface coatings sector has been hit harder post the GFC and following the strong appreciation of the Australian dollar, than the industrial paints sector. To a high degree, this sector also acts as an indicator for economic activity for the local manufacturing sector.
Excluding Woodcare, Industrial Sales were 57.84 million litres which was just under 4.4% down on the previous moving annual total of 60.5 million litres. Taking Woodcare into consideration, sales were not quite 61¼ million litres or 2.5% down on the previous year’s 62.822 million.
Automotive recorded a fall of nearly 34% from 4.76 million to the current year’s 3.14 million litres.
Protective Coatings fell 5.3% to 10.6 million litres. Marine Coatings also recorded a significant decrease of 22% to 2.1 million litres.
Road Marking Paint fell 10% to 2.76 million litres.
The Industrial Coatings sector, involving Can and Coil Coatings, other Metal Coatings and Powder Coatings, showed an increase of 4% to 32.7 million litres. In this sector, Flat Board Coatings showed the biggest increase of 21%.
The Total Market
This third party material has been provided by Australian Paint Manufacturers Federation (APMF) for education and research information.
You are not permitted to re-transmit, distribute or commercialise this information or material without seeking prior written approval from APMF.
Suite 604, Level 6
51 Rawson Street
Epping NSW 2121
Tel: 02 9876 1411
Fax: 02 9876 1433